At the 2021 GitKon Git conference, Leslie Chapman, Distinguished Engineer at Comcast, shared her story of leveraging GitHub analytics and usage data to turn around a struggling team.
Observing the Processes
For the last 20 years, Leslie has helped Comcast deliver interactive solutions for customers, enabling them to interact with their cable boxes via the remote. Internal to Comcast, this is known as the X1 platform, and currently serves over 35 million customers. As a distinguished engineer, a really big part of Leslie’s role is to observe processes and systems in order to make recommendations on how they can be improved. Her driving goal is making work easier and more enjoyable for her fellow engineers, while also improving product quality.
Leslie’s current team delivers Comcast’s Xfinity app, working as sub-teams focused on delivering the Android, iOS applications, and other areas, working in two-week release cycles. The team creates release branches on Fridays, every other week. Some sub-teams working on the product have an early code freeze early in the release week, and sometimes teams keep making changes, right down to the wire.
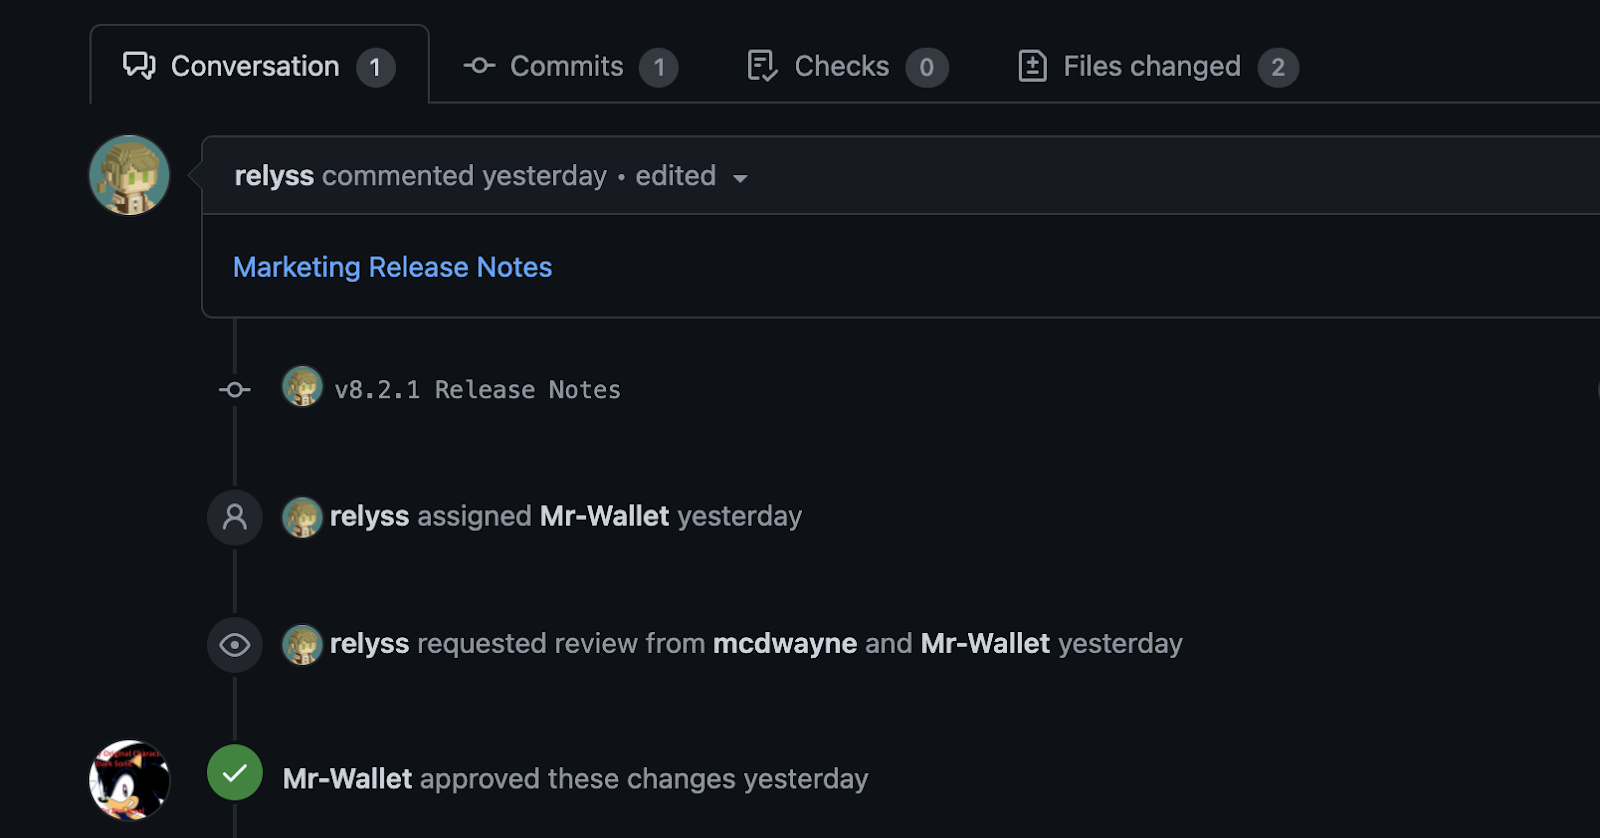
When developers on Leslie’s team are ready to Git merge, they raise a pull request, and then they link to that pull request in one of the code review Slack channels. This gives visibility of the changes to the entire team, not just the smaller squad, helping to crowdsource reviewers to get those pull requests through in a timely manner.
When Leslie first joined this team, monitoring these Slack channels gave her a lot of insight into the code, but it also gave her insight into how the team collaborated. She noticed that some people would just paste the GitHub pull request link, while others would also provide some commentary around the changes. Once someone gave a +1 in GitHub, approving the PR, they would usually reply back in the Slack channel with a little ‘approved’ emoji.
In GitKraken Client, you can not only create GitHub pull requests, you and your team can edit GitHub PRs, including adding comments, associating build status, merging, and approving pull requests without ever leaving the tool.
Some Early Hunches
One thing Leslie noticed right away was that their Android repository only required a single +1 in GitHub. She immediately raised this as a red flag. She discovered that while the team was only enforcing a +1 in GitHub, there was also a word-of-mouth “+ 2” step that needed to happen, but was not visible through GitHub.
She kept talking to engineers at all levels, from junior to very senior, to see what they liked and didn’t like about their code review processes. Some of the feedback from the junior engineers was that people weren’t adding enough comments in the reviews. Looking back to the Slack channel, she realized some people were adding a lot of context in the Slack channel, but not in the Git pull request itself.
Junior engineers also reported that they didn’t feel like they had time to review the feedback in their pull requests because they were getting approved so quickly. People felt like it was just a mad dash to get their PRs approved the day before a release branch was cut.
The most controversial piece of feedback Leslie heard was around “in-the-squad” versus “not-in-the-squad” reviews, where some people felt very strongly that reviews should only be completed by people within their working squad, arguing they should be the only subject matter experts allowed to maintain and support the code. Other people felt very strongly that it was important for people outside of their squad to be doing code reviews, that it allowed them to get fresh eyes on the code, and understand what another squad was doing that might impact future feature work.
Leslie had a few hunches on how to improve the situation, but all she had was conjecture, and as you may know, engineers don’t change systems and processes because of conjecture. She needed data to back up these theories. Thankfully GitHub has a suite of APIs that are really well documented and easy to use.
Using Git and GitHub Analytics to Answer Questions
Leslie had some questions that needed hard answers:
- Are people really getting a +2 in our android repo or are they merging with a +1?
- How long is the average code review really open?
- Are we merging a lot more on the day before we create our release branch?
- How many comments are we leaving in our code reviews?
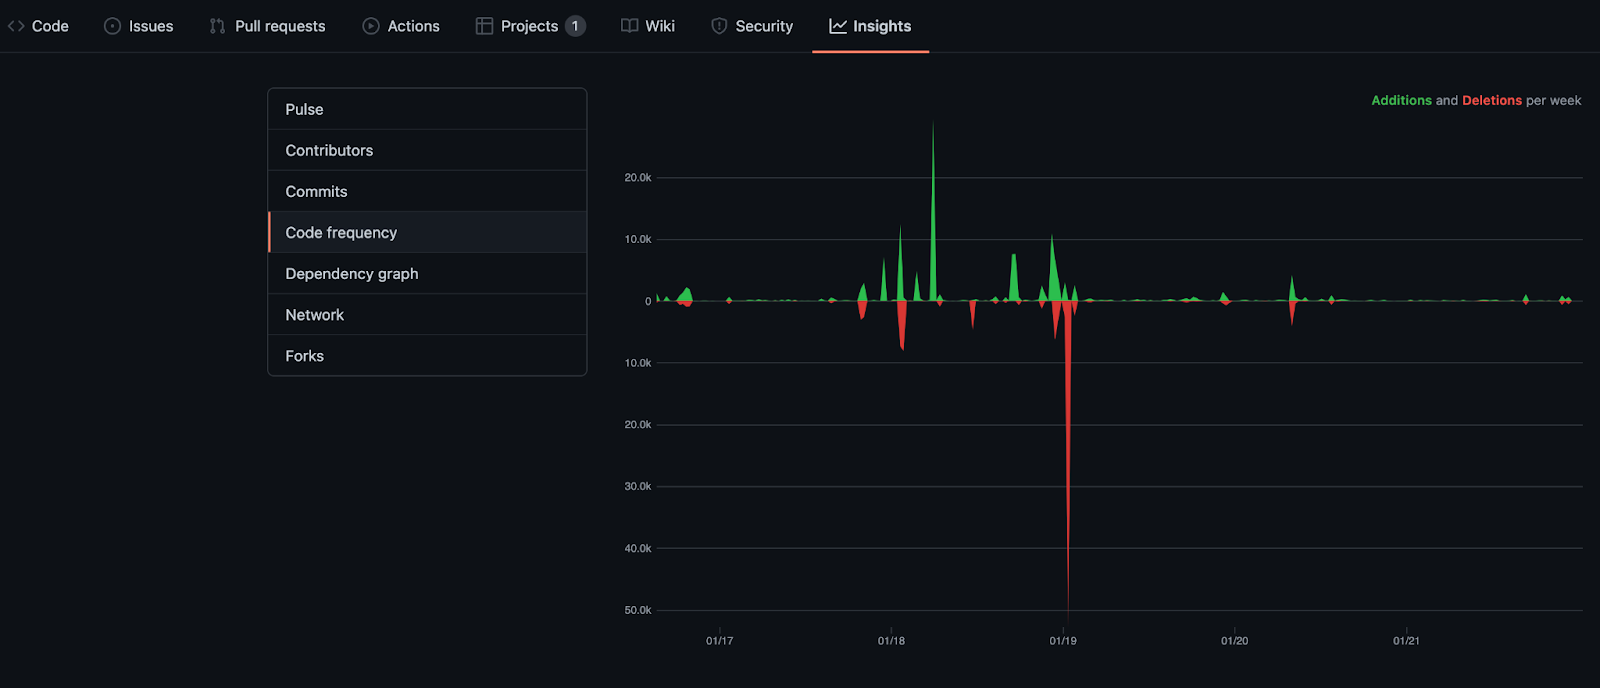
Digging into the GitHub API meant Leslie was able to walk the list of commits in each of the repos. She was interested in the delta between the time the pull request was raised and when the merge occurred, giving her insights into how long items were up for review. By walking the list of Git commits, it was also easy to see how many comments were in an average pull request.

To be transparent, this was not a perfect process. This method of investigation didn’t give insight into how long people were spending actually doing the review, just how long a pull request sat in the review state prior to a merge. Since this was just a small experiment, she also didn’t subtract for normal working hours, which varied per team, as developers were stretched across different time zones with varied office hours.
Another caveat of this approach was that Git cherry picks, which were a common occurrence in the workflows Leslie was evaluating, usually take very little time and require less scrutiny on review. This meant that cherry picks could potentially skew the GitHub metrics, showing comments taking less time overall if factored in.
GitKraken Client is the perfect example of a Git tool that has evolved to meet new challenges, with advanced features like interactive pull request management, merge conflict detection and resolution, deep linking, and more.
What did the GitHub Analytics Show?
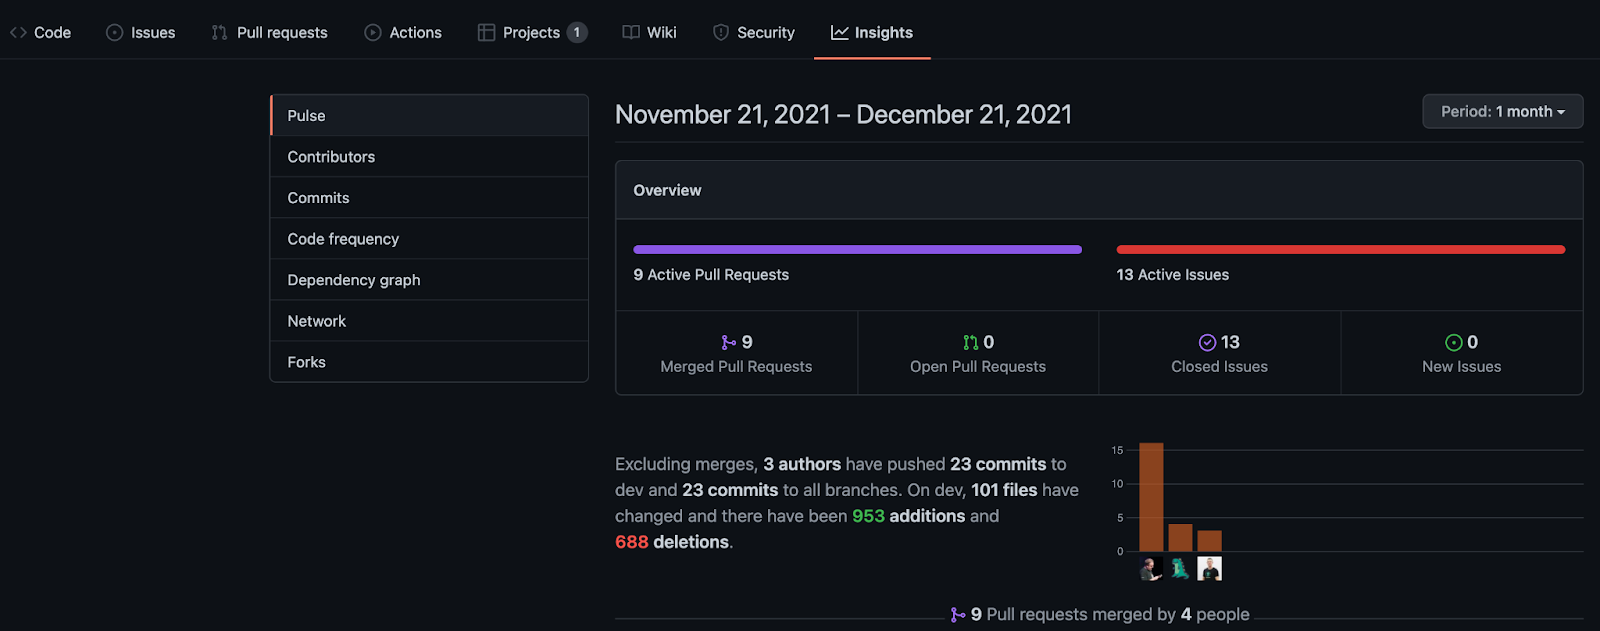
Leslie was able to determine that the vast majority of pull requests were merged within 24 hours of being raised, but a few took under 30 minutes. Overall, this seemed pretty healthy, as the team was getting things closed in a timely manner, and the GitHub data didn’t appear to show that they were just rubber-stamping the reviews.
However, looking at the day of the week reviews accrued on told a different story. There was a spike of reviews on Thursdays, right before the release branches were being cut. This was a significant spike of around 40% of the team’s total merges. This was not a pretty picture. When she looked at the delta of the closure times on those Thursday reviews, it skewed dangerously close to getting most of the PRs reviewed in under an hour. That did not smell right to her.
The final data point she looked at was around comments. The team averaged two to three comments per pull request. This was after accounting for cherry picks, which rarely have comments. That likely meant feedback was getting lost somewhere if the junior developers weren’t getting a chance to review it.
Changes Driven by GitHub Analytics
A Formal +2
The first thing she addressed was updating the Android repo to require a formal “+2” that could be tracked in GitHub. Because there was no way to prove through data that people were adhering to the word-of-mouth knowledge of getting a “+2,” this made it easier to convince the team that this formal step was needed. Everyone agreed it was better safe than sorry.
Quality Over Speed
The GitHub metrics showed that at the end of their release cycles, things were being rushed and they didn’t have time for due diligence. Meaningful changes, in terms of team culture, were made across all of the squads. All devs were encouraged to observe a soft code freeze earlier in the week. Socially, it was made clear to all the developers that it’s more important to adhere to policies around quality over getting something in at the last minute just to fit within the two-week release cycle. Their short sprints meant it wouldn’t take forever to catch the next release vehicle.
Code Owners For Reviews
The next issue to tackle was standardizing on getting reviews from inside the squad versus outside of the squad. To solve this, they started to use Git code owner files. In this workflow, a developer creates a file named CODEOWNERS, and commits it to the base of a directory or Git repository. This allows for rules about who must review a pull request.
For example, say for a certain repository, there’s a list of people, and at least one person from the list is required to approve the PR. You can get more granular, requiring different packages within the repository to have specific reviewers. This ensures the right subject matter expert (SME) reviews a given feature, but still allows for anyone that’s not on that approver list to give approvals as well. This satisfied both camps, those who wanted intra-team and inter-team reviews.
Repeatability
One of the best parts about this GitHub-data-driven approach is that Leslie could re-run her exact same scripts again in six months, and again in 12 months, to see if her teams had made meaningful progress towards process improvements.
Git Data and Career Growth
Another big part of Leslie’s role at Comcast is mentoring. While this takes a lot of different forms and every relationship is different, one thing that mentees often have in common is a desire to get a great year-end review. The good news is you can use Git and Git repository hosting service tools to put a solution in place to track your progress as a team, but also as an individual for personal and career growth.
Leslie’s advice is that you should be as thorough as possible in your end-of-year reviews and assessments. Most people can barely remember what they themselves did at the beginning of their review year, so there’s very little chance your manager, who has a dozen or more employees, will have committed to memory what you did all year. It’s your job to remind them.
While it might feel gross to brag about how awesome you are, nobody else is going to do it for you. Tell your story about why you deserve a raise or promotion by telling your manager just how awesome you are. While it’s great to talk about the things that you’ve done that are over and above your current job description, the baseline is to prove that you’re indeed doing your current job description.
Using GitHub Analytics for Annual Reviews
For most engineers, that baseline of doing the job is all about code. Whether that means writing code, reviewing code and raising issues when you see them, or other code-specific work, Git data is here to help. Going into your GitHub account, you can click on your icon on the upper right corner and select “Your profile” to can see all sorts of insights into your contributions for this year, or year over year.
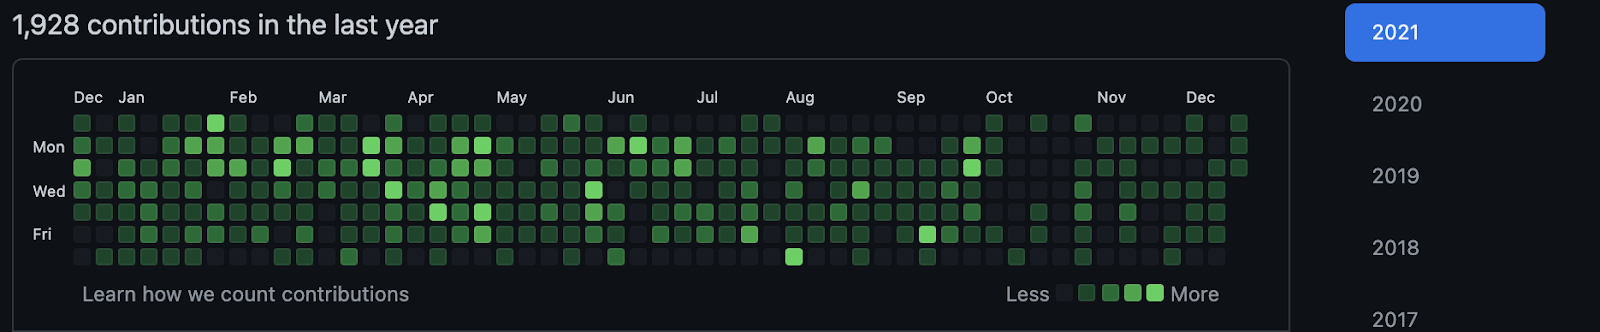
The graph showing your annual contribution grants you insight into how many code reviews you completed or how many commits you made and to what repositories. You can see how many pull requests you’ve started and how many issues you’ve raised. There’s even historical data so you can see if you’re doing more or less than previous years, and how you fare in relation to other contributors on your shared repositories.
Knowing these GitHub metrics not only allows you to show off to your manager that you might have been a top contributor for the year, but it also allows you to get ahead of your narrative on why you may not have been. For example, if you were on maternal or paternal leave this year, your commits are probably going to be less than in previous years, and that’s okay. And don’t forget to harness other systems data in your year-end review, like ticketing systems such as Jira.
Speaking of Jira…GitKraken’s tool Git Integration for Jira will bridge the gap between Jira and Git, giving your team members more visibility while reducing context switching.
Use Git Tools & GitHub Analytics to Tell Your Story
Git is ultimately a tool about storytelling. Whether it’s the story of your code, how your team worked, or how you did your job day to day, your Git history is uniquely yours. And it’s up to you to unlock the power of that story to make the world and your life better.
No matter how you harness the power of Git, GitKraken tools like GitKraken Client, GitLens, and Git Integration for Jira are there to help you keep on top of your work and track your progress.
